
Do you need to show all the data, or is summary or abstraction OK?
Perhaps the simplest example of this idea comes from medical illustration. A photograph of an organ shows every detail, but the “highlighting” in that photograph is literally determined by the lighting. The author of an anatomy textbook might instead want to “highlight” aspects of that organ that are important to a particular lesson, and thus might look to an illustrator to create a more abstract, less literal, representation for the purposes of explanation.
More subtle examples of a need for abstraction come from the realm of what is now called “big data,” where there is too much information to be visualized at once. Solutions can involve statistical manipulations (e.g. showing averages and dispersions), or the use of abstract symbols to represent different regimes in or behavior of the data.
Example: What will Astronomers see in spectra from a young star with an outflow?
In 1980, astronomers noticed that the “spectral-line profiles” coming from gas near young stars had weird asymmetries (see Snell, Loren & Plambeck 1980 for the full story). The actual spectral observations are shown in the 4-panel graphic at right, and the highly-effective cartoon explanation of the asymmetries found in the real data is shown below.
Snell, Loren, and Playback, who measured these spectral profiles, imagined that a “bipolar” outflow from the star being observed could cause asymmetries. To explain their idea, they drew, with help from a graphic artist, the (now-famous) cartoon below. Use the interactive “10Q” buttons (especially) on the cartoon-style …as even this simplified abstraction is meant for an audience (see Question 1: Who) of astronomers who have not seen this kind of behavior in spectral-line data before. For its intended audience, the L1551 cartoon is a highly-effective abstraction.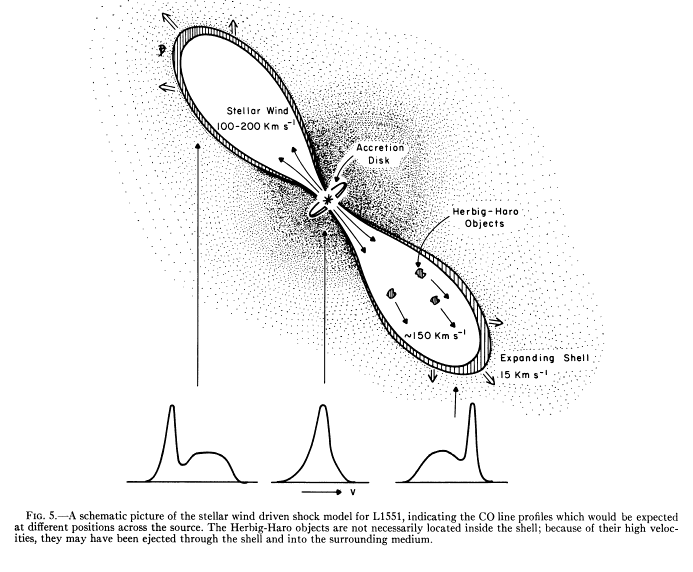
More than 3 decades later, these ideas about bipolar outflows from young stars remain largely correct. Those interested can read more about L1551 and its importance in the article about “My Favorite Object L1551 IRS5,” cited below.
(Image) Source: Snell, R., Loren, R., & Plambeck, R. (1980). Observations of CO in L1551 – Evidence for stellar wind driven shocks. The Astrophysical Journal. http://adsabs.harvard.edu/full/1980ApJ…239L..17S
More background: Fridlund, M. (2016). My Favorite Object L1551 IRS 5. http://arxiv.org/abs/1603.06704
Last Revised: 03/09/17, Alyssa Goodman